The AMORE SPD Graphical User Interface ( GUI )
General Overview
The purpose is to display few histograms that can give prompt feedbacks on the SPD data taking for shifters.
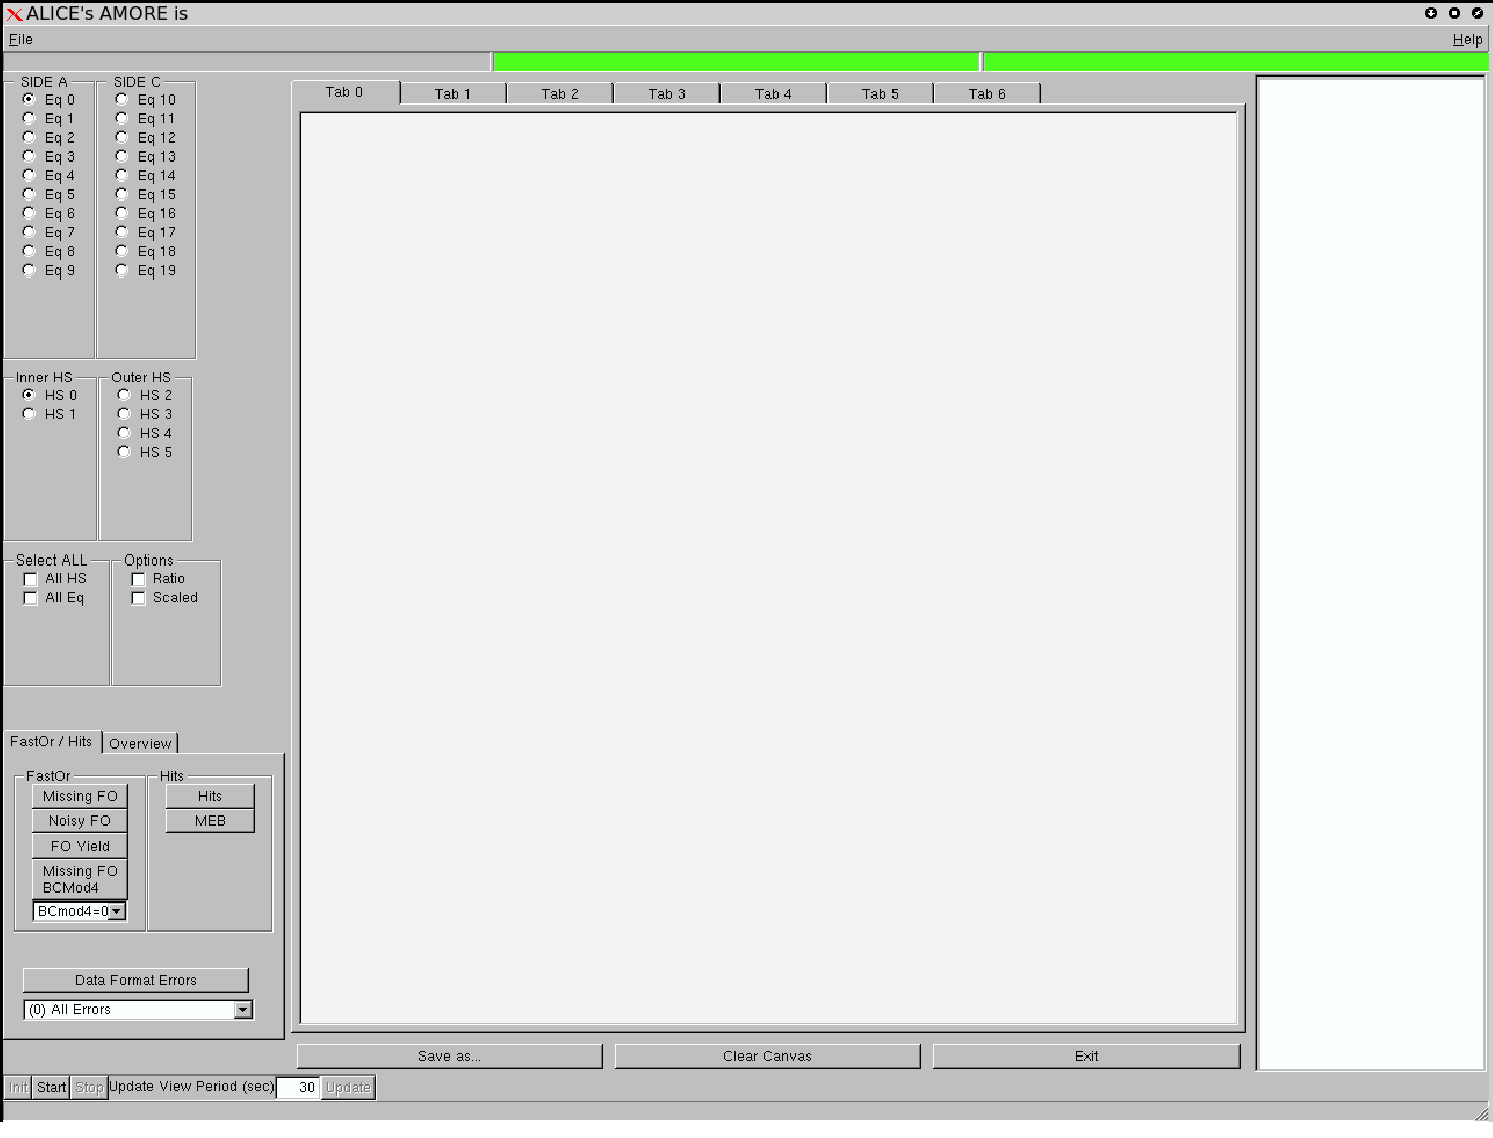
You will first see the general amore UI interface :

Opening it up, it will appear like the picture below :
Once the amoreSPD gui is opened, please click the bottom left button "Start" and wait some seconds.
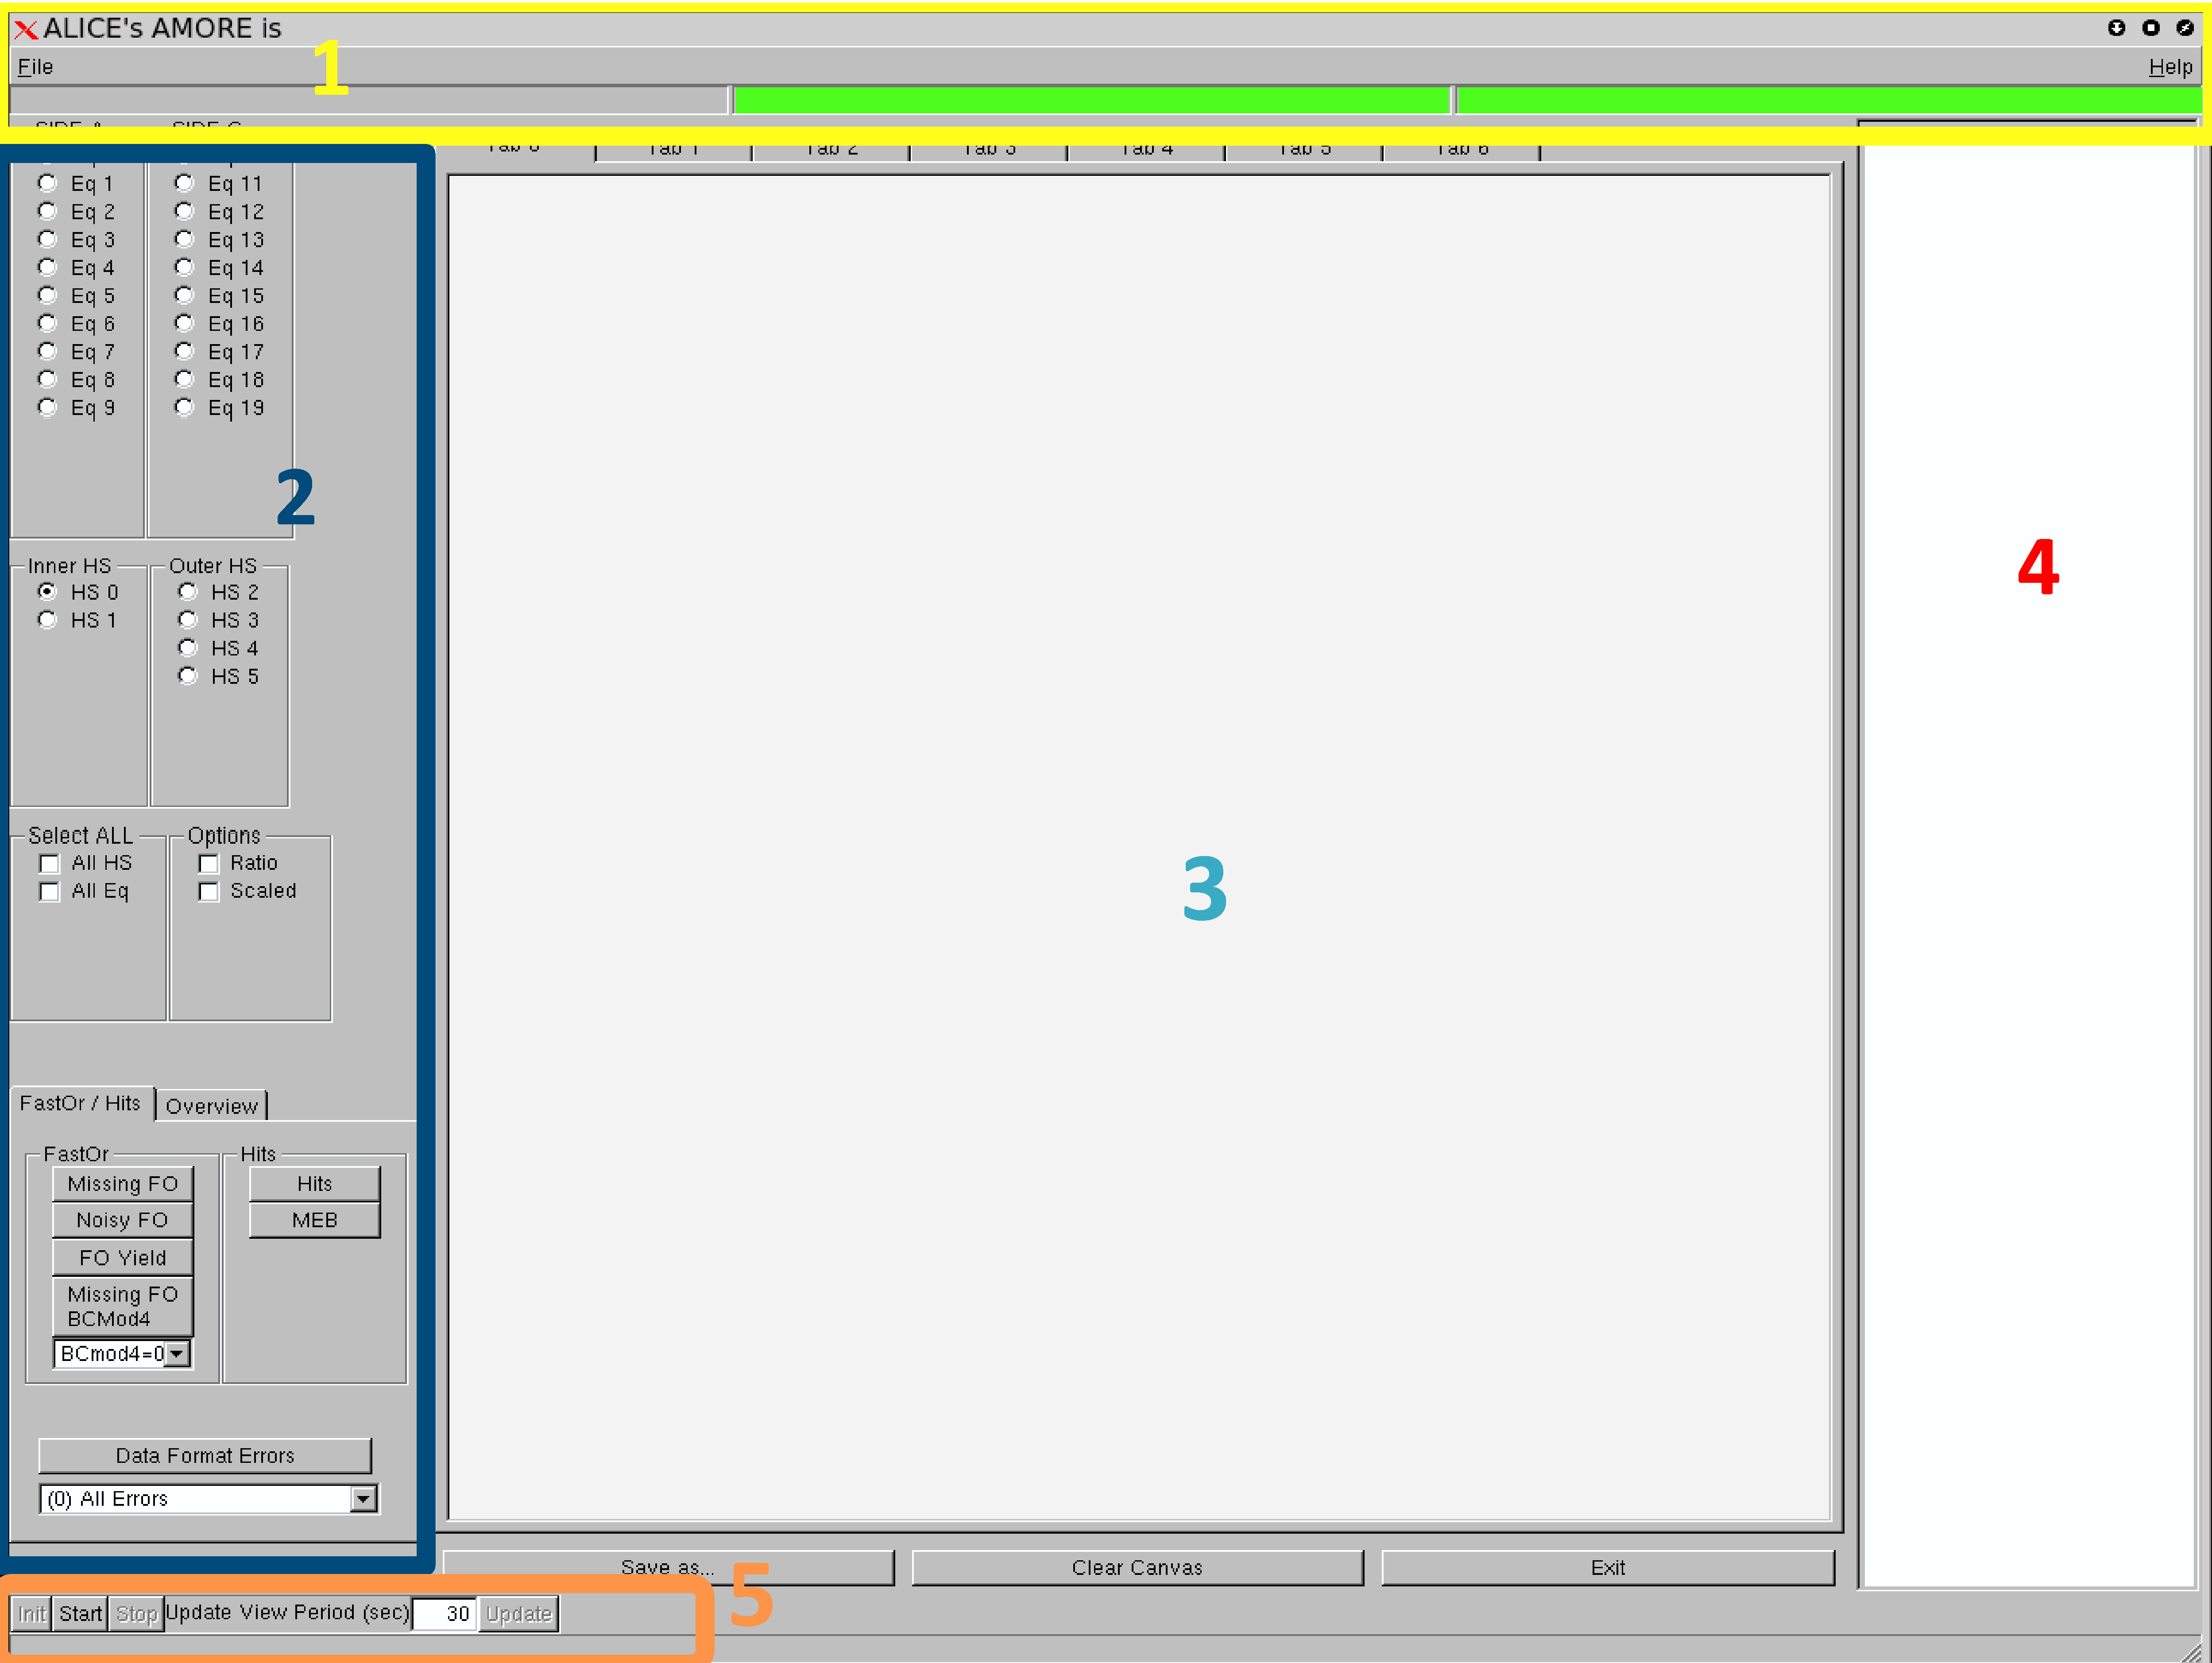
The amore GUI has 5 main parts as it is shown below :
List of the data format errors here
1) The status bar
the three bars show the general overview of the monitoring process :
If the SPD agent is not running the center bar becomes orange and some information on the monitoring objects are provided. In this case, please restart the agent. If you do not know how to do it, here there is an explanation on how to do it at P2.
If the error checks show some problem, this is how the status bar can change. This has to be immediately notified to the ITS shifter or to the SPD OnCall expert.
![]()
2) Histogram : selections, options and drawing
The left part of the monitoring GUI is divided into three zones.The upper one includes the equipment and the halfstave selection panels (the default value is Eq 0, HS 0).
The middle part allows to make some selections on the histograms :
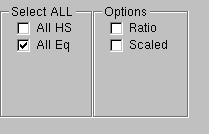
The left part allows to either display all the HS in the previously chosen equipment or to display the chosen quantity (FasOr yield, Pixel hits, etc.) for all the equipments.
The righ part allows to display the ratio of the chosen quantity (Missing FastOrs or noisy FastOrs) or scales the chosen quantity by the number of events where SPD had data. Please note that the ratio
is computed only when meaningful (e.g.: missing Fast-Or per chip done as # missing Fast-Or bits / # expected Fast Or bits or noisy Fast-Ors per chip done as # noisy Fast-Or bits / # total Fast Or bits ).
At the bottom the summary of available histograms is shown in two different tabs : FastOr/HIts, overview. In the second tabs some general quantities can be displayed as multiplicity per event or FastOr correlation.
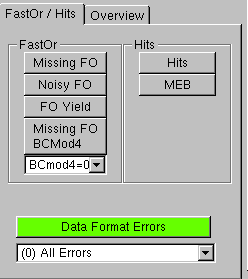
To draw the histogram, one has to click on the button and the histogram with the previous selections (Eq, hs, scaling option, etc.) will be displayed in the central tabs (part 3).
Once the button is clicked it gets green and its name appears in the central tabs..
3) Dispalying tabs
The central part of the amore SPD GUI has 7 main tabs. They will display the histograms. Below you can see how the pixel hits per equipment would look like :
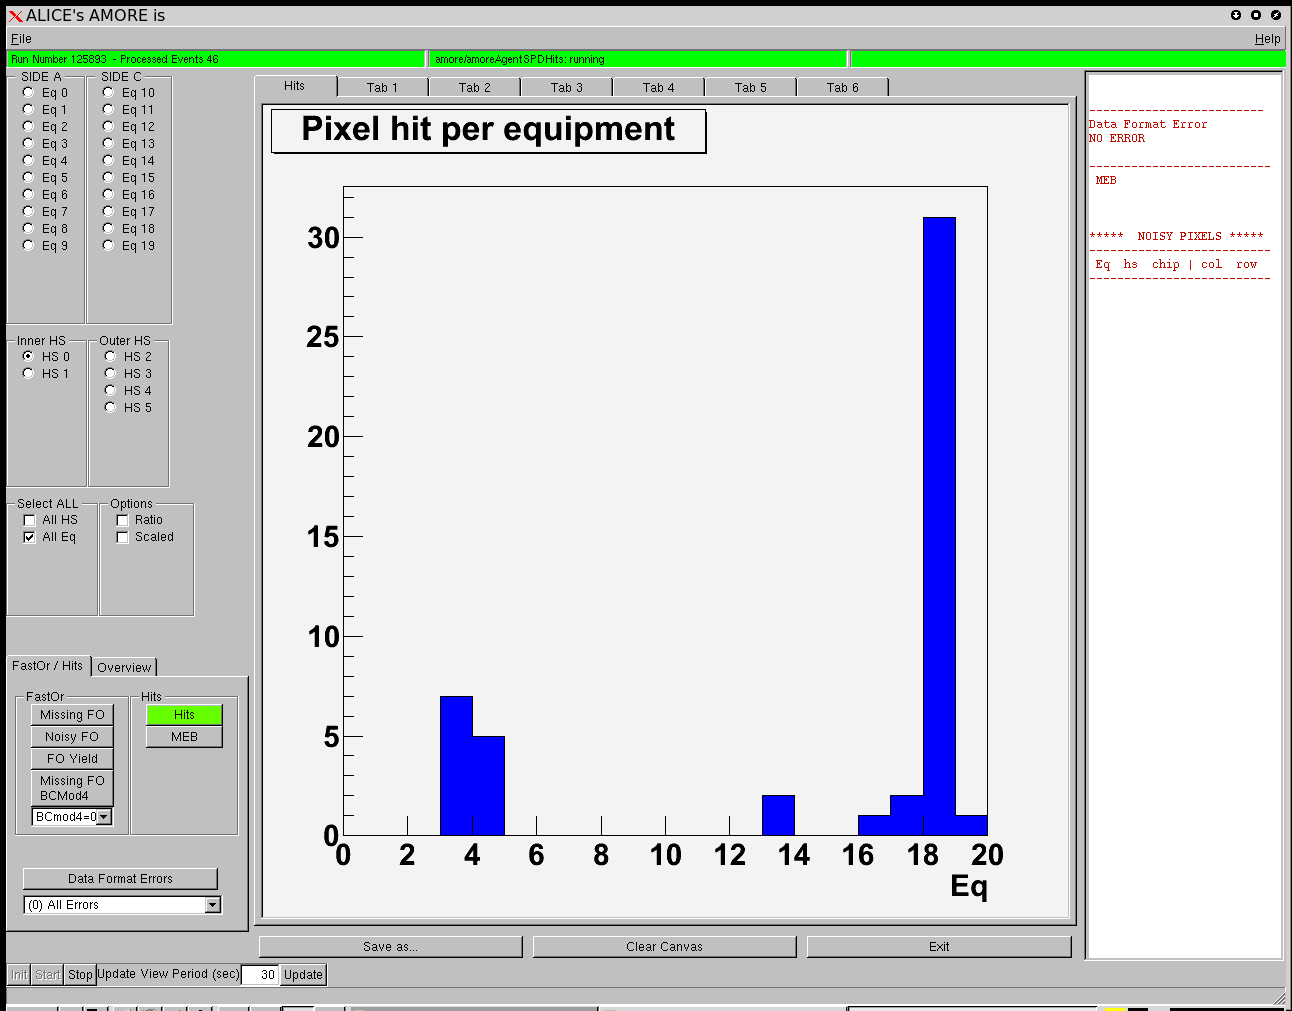
At the bottom you can see 3 buttons. If you want to save the displayed image, please click on the "Save As" button.
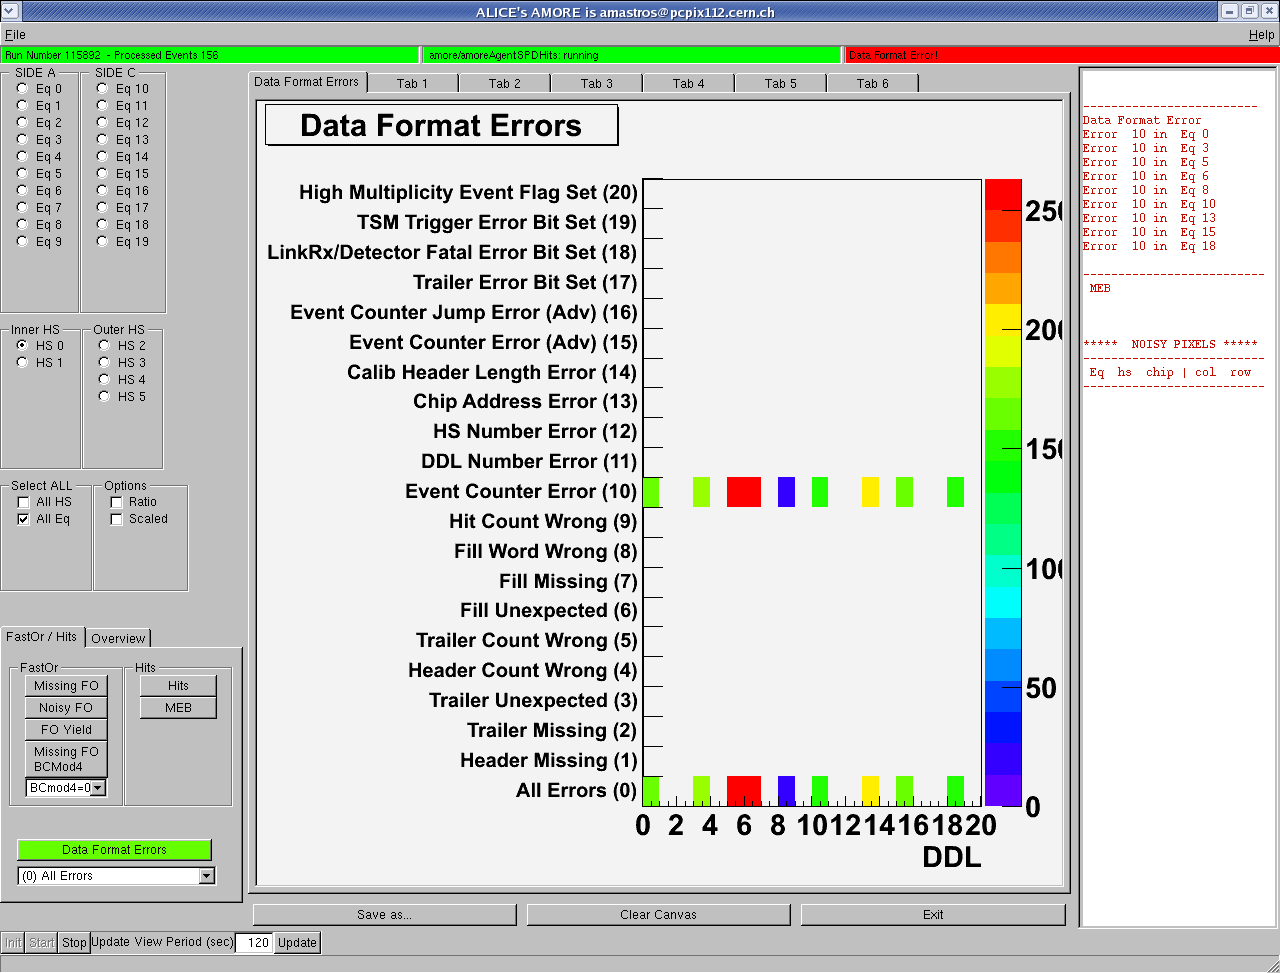
4) Monitoring processing Status : check results and online noisy pixel search results
On the rightermost side one can find some informaiton on : error check status and online noisy pixel detection.
Below you can see the result obtained by a run which had some data format errors :
The online noisy pixel search is performed as in the Detector Algorithm case at the EndOfCycle stage. The user can change the parameters for this by editing the text physics_params.txt provided by the amoreConfigFilesBrowser. If one wants to edit the file, one has to connect to aldaqbl210A and then type amoreConfigFilesBrowser d SPD &. A panel similar to this will pop up :
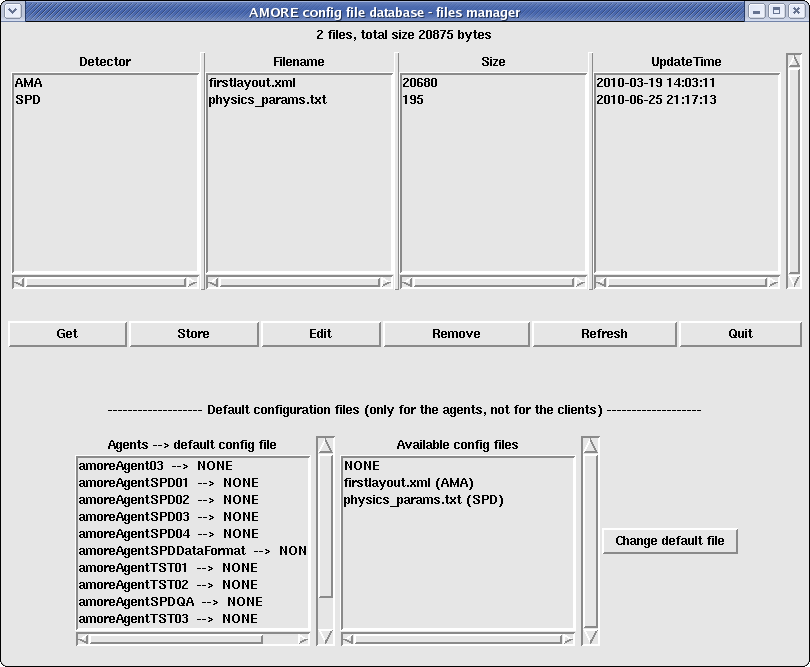
At this point, click on the Edit button, change the txt file, save it and close it. It will be automatically saved in the amore database. The relevant parameters for the noisy pixel online finding are two : fDefinitelyNoisyRatio and MistakeProbabilityNoisy. The first parameter is the fraction of time the pixel is firing wrt the total number of events and it is set to 0.3 at P2. The second one is related to the binonial probability search and it has been agreed to set it to 0 at P2 (please write an email to Annalisa.Mastroserio@cern.ch for more details).
5) Amore environment : Start, Stop, Update.
Clicking on Start, the GUI will retrieve the histograms as oublished by the amoreSPD agent, whereas clicking on Stop such a process is stopped. In a run at Point 2 the GUI should have the Start button disabled since it should bave been clicked beffore. Update is a crucial button because it will ask to the GUI to pick the latest published monitoring objects and it will redisplay the chosen histograms on the GUI. In this case, please note that the histogram layout will be the default one. The number which apperas beside the Update button shown after how many seconds the histograms should be updated, so increasing it one has the possibility to look at the histogram for more time without seeing it changing.
You can find some more technical details on amoreSPD functionalities in the final report of the 2010 Summer Student Marco Van Woerden here