The ALICE Quality Assurance (QA) framework provides the tools to check the data quality in both offline and online mode. To monitor the global data quality during the data taking (or online mode) each detector should provide few histograms which are checked in the ACR by the DQM shifter.
The list of the histograms which have been agreed so far within the SPD team will be described. All the plots have been exctracted by run 118507 (~200k events). How the plot should appear in both standard conditions (Normal situation) and Problematic situations will be discussed. As soon as a problematic situation occurs the SPD shifter or the OnCall expert must be informed.
1) Data Format
This plot shows the number of data format errors per DDL or equipment ( 10 on side A and 10 on side C).
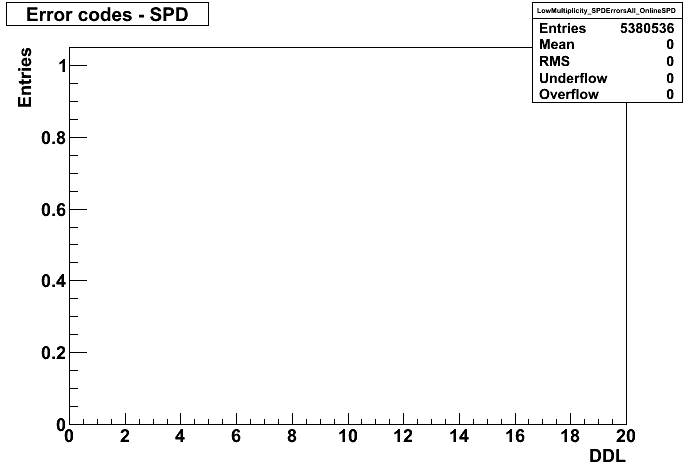
- Normal : the histogram is filled ( # entries > 0) but there is no data format error on any DDL (or equipment).
- Problematic : at least one of the DDLs shows an entry > 0. This has to be immediately notified to the SPD shifter. The SPD shifter has to look at the error number ( SPDmood or amoreSPD). If the error number corresponds to 20, the run can continue.
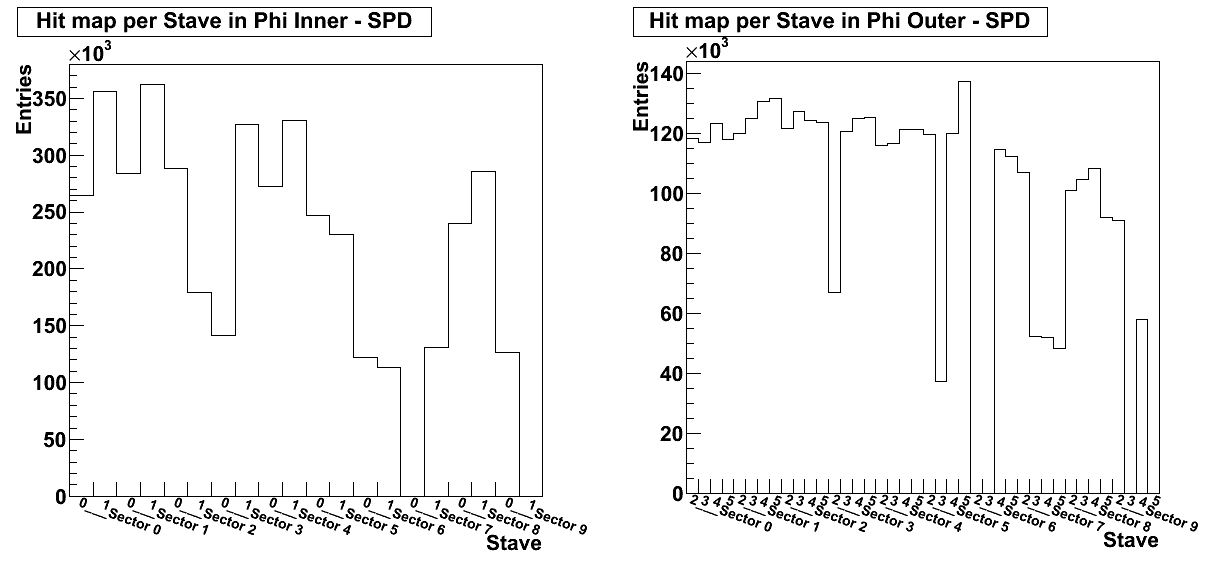
2) Hitmap
Two QA histograms show the hitmaps per chip in both layers. The plots are filled with the number of pixel hit per chip. The Y axis shows the SPD sector number "S X" and the Half Stave (HS ) number. In online notation the HS belonging to the inner layer are always 0 and 1, whereas the ones belonging to the outer layer are always 2,3,4,5. The X axis shows the chip number in online notation.
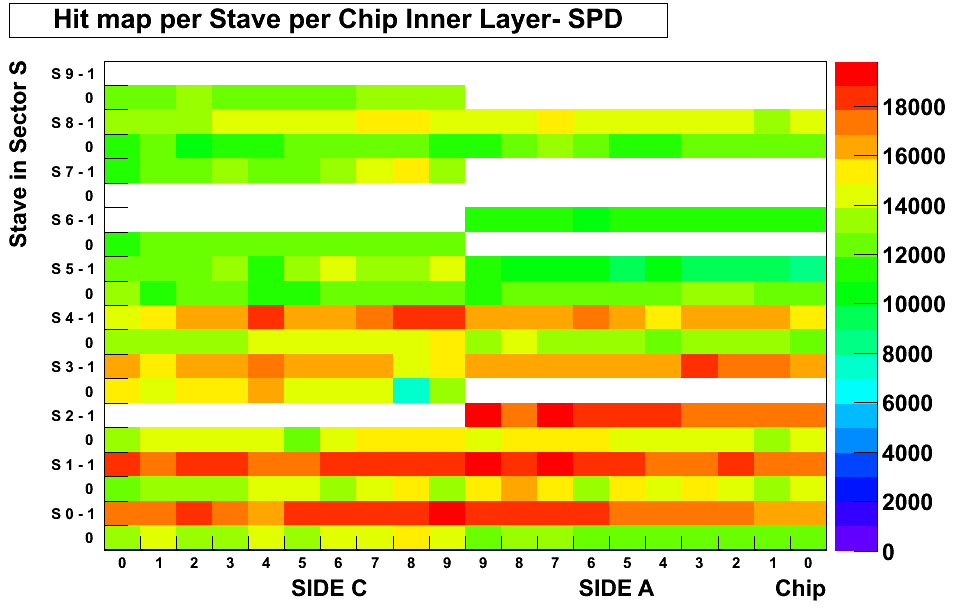
- Normal : the histogram should be quite uniformly filled. It may happen that a noisy pixel pops up, therefore the chip which contains such a pixel will have a much bigger number of counts (see outer layer map for more details). If a noisy pixels appears, it will be seen in only ONE chip, so the general HS trend is not affected. Please note that more than one moisy pixel can be present. The noisy pixel(s) will be removed at the reconstruction level, therefore it does not represent a problem. It may become a problem only if the rate of some FastOr trigger algorithms increases.
- Warning : More than one chip shows noisy pixels. Action : look at the Fast-Or map. As mentioned before noisy pixels are not a problem, unless there is some consequence on the SPD L0 trigger rate. In general if the trigger rate increases, it is important to cross check this map with the FastOr map (shown below). The chip which contains noisy pixel(s) can also be noisy at FastOr level and it can represent a contribution to the increased trigger rate.
- Problematic : one or more HS are poorly filled ( ~1% of the general HS trend ).
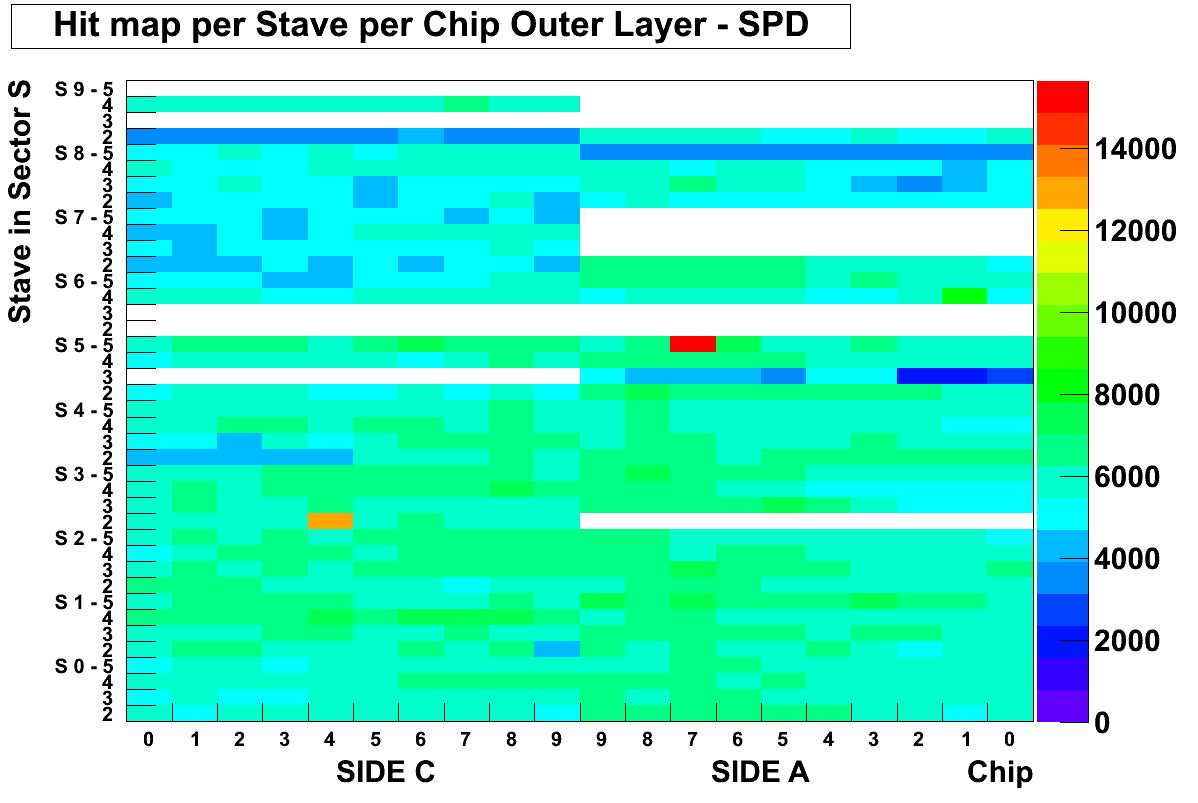
- Normal : the histogram should be quite uniformly filled. It can happen that a noisy pixel pops up, therefore the chip which contains such a pixel will have a much bigger number of counts.The noisy pixel will be removed at the reconstruction level, therefore it does not represent a problem to spot. It becomes a problem only if the rate of some FastOr trigger algorithms increases. An example is given by chip 7 in Sector 5, side A, HS 5. Note that there is no corresponding noisy chip 7 in the FastOr map.
- Warning : More than one chip shows noisy pixels. Action : the shifter should cross check the L0 trigger rate coming from SPD. As mentioned before noisy pixels are not a problem, unless there is some consequence on the trigger rate. If the trigger rates increases, it is important to cross check this map with the FastOr map which is shown below. The chip which contains noisy pixel(s) can also be noisy at FastOr level and it can represent a contribution to the increased trigger rate.
- Problematic : one or more HS are poorly filled ( ~1% of the general HS trend ).
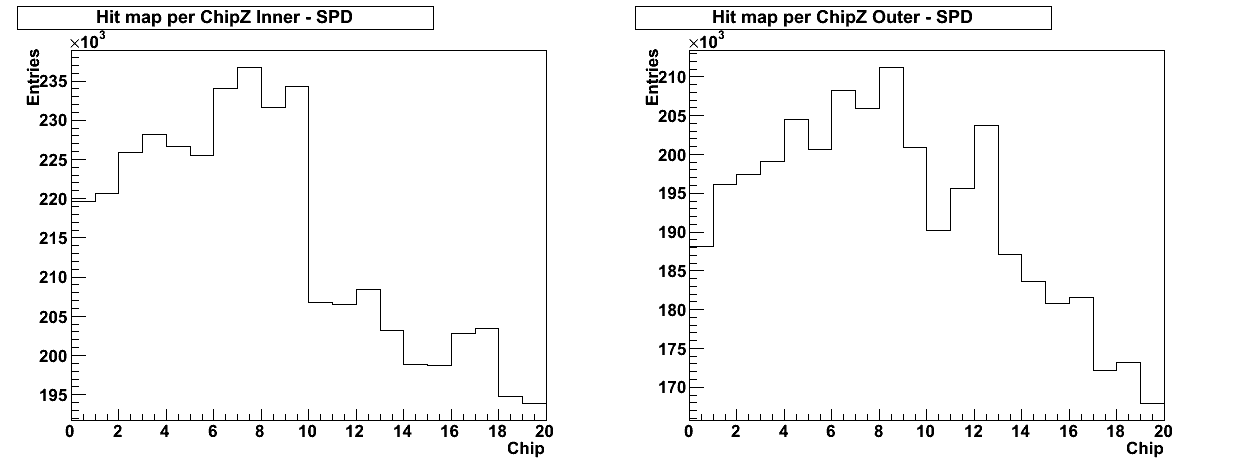
In the next plots the projections of the previous maps in Phi and Z are shown. These histograms are on their way to be replaced by another histogram : the histograms of the chips which can hide a Multi Event Buffer (MEB) problem.
3) Fast Or bit map
Another QA histogram is represented by the FasrOr bit map. It does not distinguish between inner layer and outer layer and the notation is more compact ( this is a compromise since there is a restriction on the number of non-expert histograms, it can be improved if needed anyway). In this plot the Y axis is represented by the chip number whereas the X axis shows the HS number (more details on the conventions can be found here ). In this case one can observe that the chip 7 is not noisy from te FastOr point of view. On the contrary there is a noisy chip from the FastOr point of view ( chip 1 in one of the last HS on the right) which has no corresponding noisy pixel inside.
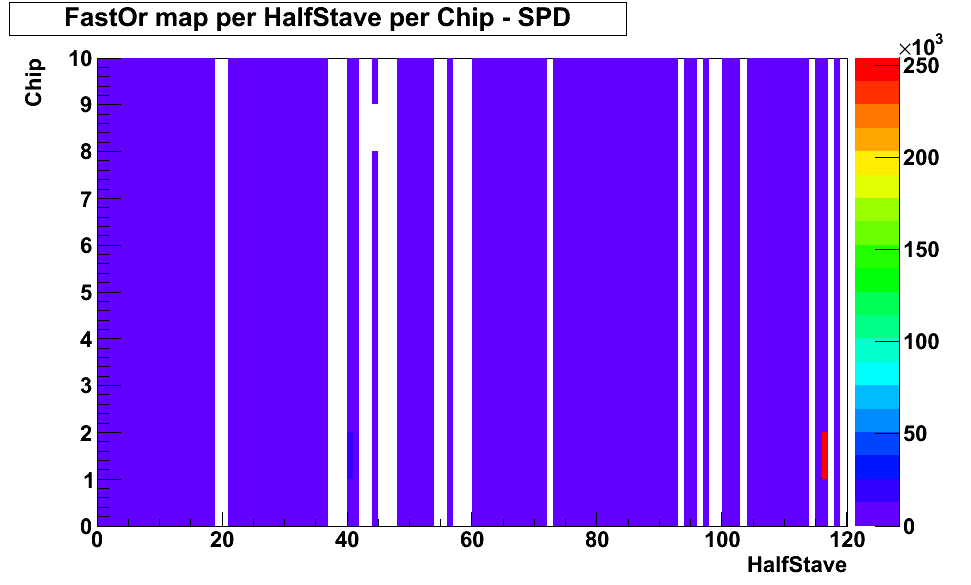
- Normal : the histogram should be quite uniformly filled.If a noisy FastOr pops up it should not be a problem unless the trigger rate increases. Please note that NOT ALL the chips partecipate to the trigger logic.
- Problematic : more than one noisy chip appears AND the trigger rate increases.
4) Hit correlation
This histogram shows the multiplicity correlation between the two SPD layers. Basically in pp collisions most of the entries lay on the diagonal, which is not the case in test runs. It gives a feedback on the type of the physics runs which is ongoing.
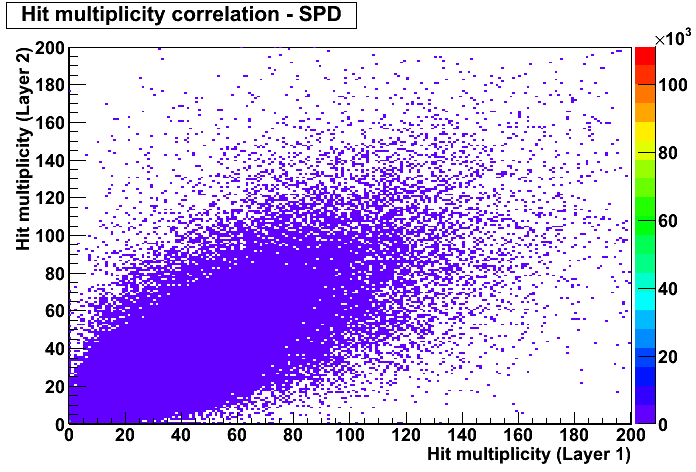
- Normal : in pp collisions the majority of the entries lay on the diagonal.
- Problematic : no report.
5) Multi Event Buffer problem (MEB)
This QA histograms shows if for some chips the MEB prolem is suspected to be present. The notation is more compact than in the previous cases ( same compromise as for the fast)r map, but it can be improved).
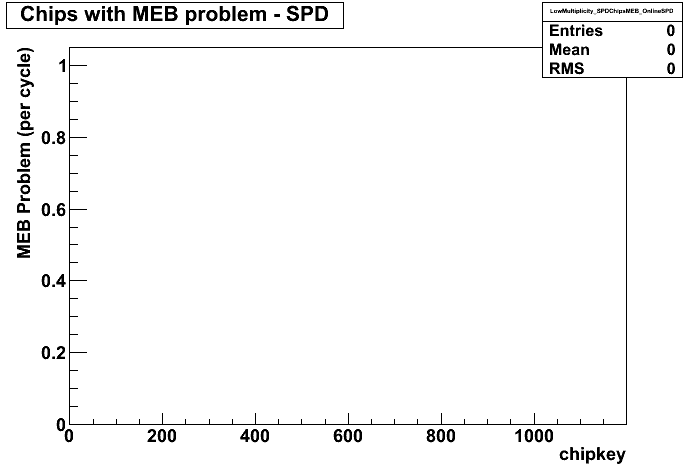
- Normal : no entry.
- Problematic : at least one entry AND the entries in that chip for both Pixel hits and FO should be > 30 .
The chip has to be localized.